Page 1 of 2
updated interactiveGraph block
Posted: Sat Apr 03, 2021 9:46 pm
by davidefa
Update the block to include additional sensors
ver 11.4c
- sensors grouped ( differently )
- added 2 axis graphs
- added option to rename multiple sensors
- added multiple sensors graphs: PP#, SM#, ST#, T#, H#, CO2_#
ver 11.4d
Added an option to handle 'events' ( leave blank if not used )
Currently supported ( may be expanded if needed ):
raining,MM ( shows precipitation when RR>0 in the last MM minutes, if MM=0 uses the data from meteotemplateLive.txt, if MM>0 uses data from database )
windy,SS,MM ( shows wind when wind speed > SS in the last MM minutes, if MM=0 uses the data from meteotemplateLive.txt , if MM>0 uses data from database, SS is expressed in the same unit as saved in database )
windyG,SS,MM ( shows wind when wind gusts > SS in the last MM minutes, if MM=0 uses the data from meteotemplateLive.txt, if MM>0 uses data from database, SS is expressed in the same unit as saved in database )
Re: updated interactiveGraph block
Posted: Sat Apr 03, 2021 10:10 pm
by Semtex
Perfect !!
Grazie
Re: updated interactiveGraph block
Posted: Sun Apr 04, 2021 10:37 am
by meteolopik
Super!! Thanks a lot

Re: updated interactiveGraph block
Posted: Sun Apr 04, 2021 8:23 pm
by meteolopik
T1 (extra temperature sensor 1) is not working for me, not sure if my settings are wrong. I named it T1 as in te database.
Re: updated interactiveGraph block
Posted: Sun Apr 04, 2021 10:58 pm
by davidefa
Corrected visualization of external temperature and humidity.
Re: updated interactiveGraph block
Posted: Mon Apr 05, 2021 4:58 am
by meteolopik
Fixed here! Thank you so much!
Re: updated interactiveGraph block
Posted: Tue Apr 06, 2021 8:01 pm
by meteolopik
Found another small bug. In extra temp the temperature does not go below 0

Re: updated interactiveGraph block
Posted: Wed Apr 07, 2021 9:44 am
by davidefa
Removed 0° minimum for external temperature
Re: updated interactiveGraph block
Posted: Wed Apr 07, 2021 1:57 pm
by meteolopik
davidefa wrote: ↑Wed Apr 07, 2021 9:44 am
Removed 0° minimum for external temperature
Superb!!
Re: updated interactiveGraph block
Posted: Wed Apr 07, 2021 6:22 pm
by meteolopik
- The dewpoint color in the temperature group stays white eventhough another color is set in the settings.
- Barometric pressure is not loading (pull from database incorrect maybe?
Re: updated interactiveGraph block
Posted: Wed Apr 07, 2021 8:11 pm
by davidefa
Corrected visualization of pressure sensor and color of dew point
Re: updated interactiveGraph block
Posted: Thu Apr 08, 2021 2:16 pm
by meteolopik
davidefa wrote: ↑Wed Apr 07, 2021 8:11 pm
Corrected visualization of pressure sensor and color of dew point
Great, works as a breeze!

Re: updated interactiveGraph block
Posted: Sun Apr 11, 2021 7:28 am
by meteoesine
ciao Davide, complimenti per il tuo skill, bravo!
ti propongo una ulteriore modifica, se fattibile:
in caso di precipitazioni in corso, si potrebbe far visualizzare il grafico della pioggia? poi, quando smette di piovere, ritornare al grafico con il parametro impostato di default
(praticamente una opzione che se piove visualizza il grafico precipitazioni, se non piove, quello di default)
grazie
Re: updated interactiveGraph block
Posted: Mon Apr 12, 2021 11:03 am
by davidefa
Added an option to deal with 'events'
Currently supported ( may be expanded if needed ):
raining,MM ( shows precipitation when RR>0 in the last MM minutes, if MM=0 uses the data from meteotemplateLive.txt, if MM>0 uses data from database )
windy,SS,MM ( shows wind when wind speed > SS in the last MM minutes, if MM=0 uses the data from meteotemplateLive.txt , if MM>0 uses data from database, SS is expressed in the same unit as saved in database )
windyG,SS,MM ( shows wind when wind gusts > SS in the last MM minutes, if MM=0 uses the data from meteotemplateLive.txt, if MM>0 uses data from database, SS is expressed in the same unit as saved in database )
P.S.
Today should be the right day to test it
Re: updated interactiveGraph block
Posted: Mon Apr 12, 2021 2:47 pm
by meteoesine
GREAT !!!!
tnx
Re: updated interactiveGraph block
Posted: Wed May 19, 2021 10:26 pm
by davidefa
ver 11.4f
Minor update: added the capability to show only a subset of extra sensor.
For example if you want to show only extra sensor T3 and T4 set
Code: Select all
Name of Extra Temperature sensors: 3=name3,4=name4
( settings are compatible with previous version )
ver 11.4g
Corrected a bug in wind bearing calculation ( no correction should be applied to bearing, but I applied the same correction of wind speed )
Re: updated interactiveGraph block
Posted: Fri Aug 13, 2021 4:15 am
by linux150
Thanks for your update.
I´ve a problem with showing UV. UV is on true, but not shown,,,,
I DONT HAVE A SOLAR Sensor, so i didn´t aktivate in main settings.
Now i think, maybe UV is only shown WITH Solar Sensor is activated ?!
Any solution ?
PS: How can i make the bearing graph a little bit smaller?
EDIT: I tried and switched the "Solar Sensor" to true and now uv is shown! But i dont want this settings, because Solar shows allways empty entries in other blocks or actually data...
Maybe i try to edit the php file, will take a look ...
LG
Martin
Re: updated interactiveGraph block
Posted: Sat Aug 14, 2021 3:23 pm
by linux150
So i answer myself, i did by try and error, because im an absolutly newbie in programming php (but i learned a lot, installing meteotemplate
)
So i copied some parts and changed the parameters so now it works ONLY with UV Sensor and NO SOLAR SENSOR for my sensor conditions.
Maybe it helps somebody with same problem ....
LG
Martin
Re: updated interactiveGraph block
Posted: Thu Dec 23, 2021 10:16 pm
by davidefa
ver 11.4i
Minor update: added evapotranspiration
Re: updated interactiveGraph block
Posted: Sun Jan 16, 2022 10:50 pm
by mchd17
Another good block, thanks
Re: updated interactiveGraph block
Posted: Mon Jan 17, 2022 2:59 pm
by Laglene
Hello Davide,
Thank you for this interactivegraph block, however a question please
How to change the color of the curves thank you
Didier
Re: updated interactiveGraph block
Posted: Mon Jan 17, 2022 5:58 pm
by Laglene
Bonsoir Davide,
Désolé, la réponse est dans le nouveau block. je n'avais pas assez exploré votre travail.
Encore merci pour tout ce que vous faites.
Didier
Re: updated interactiveGraph block
Posted: Sun Feb 27, 2022 8:39 pm
by davidefa
ver 11.6
- minor update to remove some nasty side effects when customGraph block is installed too
( this update is only needed if you use block customGraph )
ver 11.7
- minor update: added option to show max solar radiation ( calculated ) along measured one
Re: updated interactiveGraph block
Posted: Tue Mar 22, 2022 2:47 pm
by Gerrit
Good day to you,
what a nice adjustments these are, especially the possibility to show graphs of the soil sensors, that was the only thing that kept me with another software package, which I will stop right now.
I do have a small problem, which is also with the original file, that during the loading the program temporarily freezes.
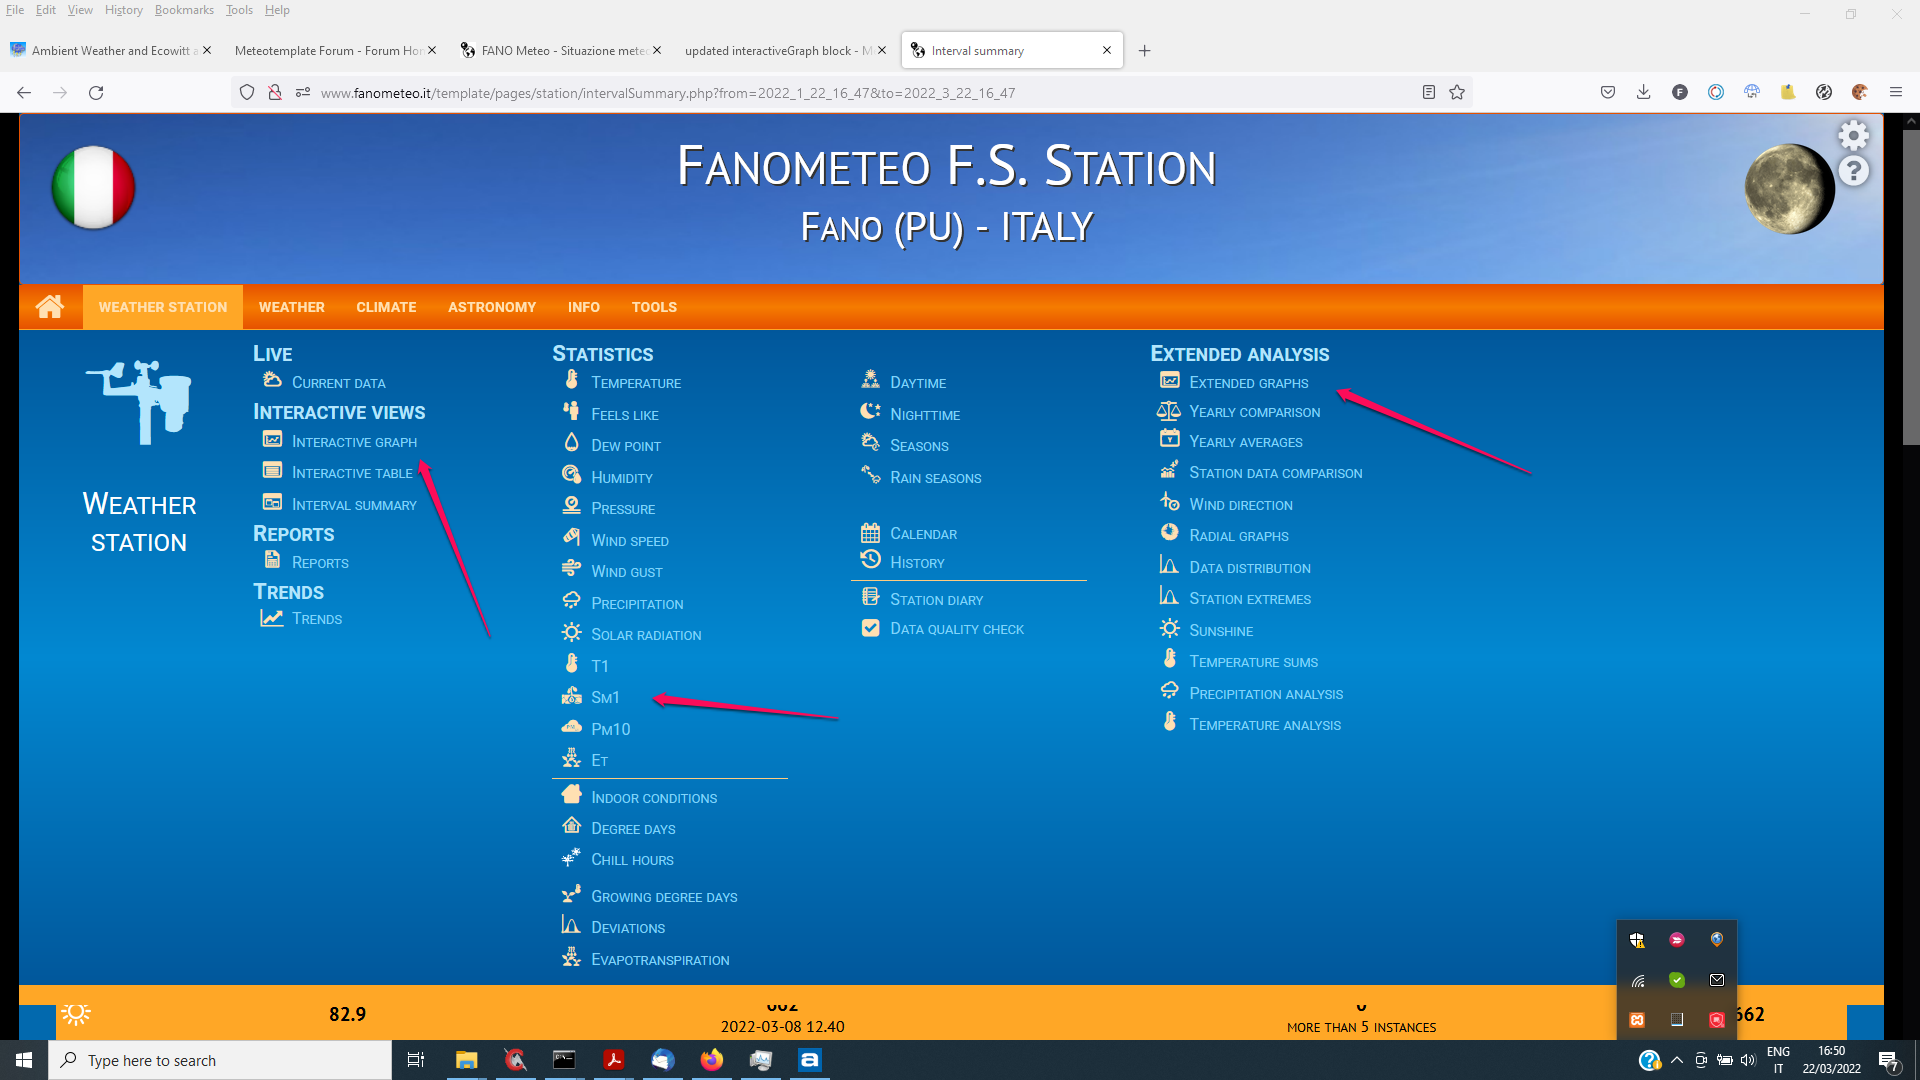
Furthermore, I have the question if there are also adjustments possible to view the history of the ground sensors, I have data from 2018 onwards.
Gerrit
Re: updated interactiveGraph block
Posted: Tue Mar 22, 2022 4:18 pm
by davidefa
I'm currently working on extending The interactive and the extended graphs.
I've already updated the 'statistics' pages ( but currently didn't post the mod )
Please post a link to your site so I can take a look at the 'freezing issue'
- interactive01.png (293.01 KiB) Viewed 4519 times
