updated windRose block
-
- Expert
- Posts: 862
- Joined: Tue Jan 12, 2021 8:03 am
- Location: Italy
- Station model: WH2650
- Software: WH2650 (direct upload)
- Contact:
updated windRose block
Added a couple of options to show wind speed information in different colors.
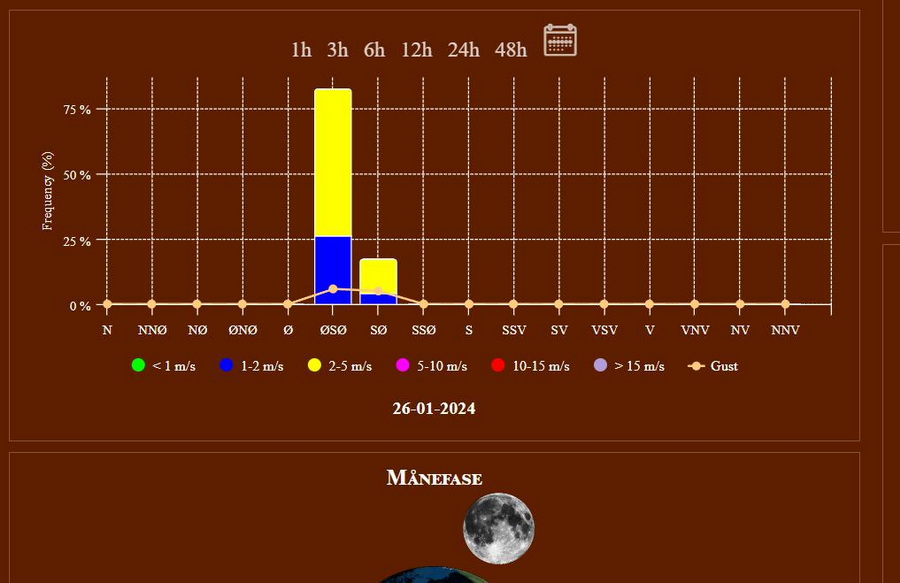
Speed scale and colors defined in options.
- Attachments
-
- windRose_1.2g.zip
- (4.68 KiB) Downloaded 144 times
- Jolumarali
- Forecaster
- Posts: 240
- Joined: Sun Aug 20, 2017 2:06 pm
- Location: Lignerolles
- Station model: Vantage Vue
- Software: WlIP
- Contact:
Re: updated windRose block
perfect thank you
Station météo amateur Lignerolles
OS : Windows 10 Famille
Vantage Vue
Weatherlink 2.0 (WlIP)
Meteotemplate 18.0 Papaya
https://meteo-lignerolles.fr
José Luis
- meteolopik
- Observer
- Posts: 26
- Joined: Tue Jun 04, 2019 11:09 am
- Location: Lopik
- Station model: Davis Pro 2 Plus
- Software: Weather Display
- Contact:
Re: updated windRose block
Sweet, thanks!
- tobydude
- Forecaster
- Posts: 192
- Joined: Sun Jan 07, 2018 6:43 pm
- Location: Norway
- Station model: Netatmo
- Software: Weatherdiaplay
- Contact:
Re: updated windRose block
Great with colors.
Is it possible to add colors for highest "gust"?
https://fjærvollan.no/template/indexDesktop.php
Is it possible to add colors for highest "gust"?
https://fjærvollan.no/template/indexDesktop.php
-
- Expert
- Posts: 862
- Joined: Tue Jan 12, 2021 8:03 am
- Location: Italy
- Station model: WH2650
- Software: WH2650 (direct upload)
- Contact:
Re: updated windRose block
What do you mean by saying "add colors for highest gust" and how would you like to represent it?
If I understand correctly you would like to superimpose, to the actual windrose, a line representing the 'maxgust' ?
( for example a radar graph superimposed to our windrose )
example radar graph windrose + "radar gust" ( you can clearly understand my "artistic" capability )
Not very easy to read/understand
- tobydude
- Forecaster
- Posts: 192
- Joined: Sun Jan 07, 2018 6:43 pm
- Location: Norway
- Station model: Netatmo
- Software: Weatherdiaplay
- Contact:
Re: updated windRose block
"you would like to superimpose, to the actual windrose, a line representing the 'maxgust'",
yes, I guess that is what I ment.
I finally got the wind gauge on top of my roof, (today) and deleted det database for wind and direction.
Just to start from scratch.
yes, I guess that is what I ment.
I finally got the wind gauge on top of my roof, (today) and deleted det database for wind and direction.
Just to start from scratch.
-
- Advisor
- Posts: 89
- Joined: Fri Sep 24, 2021 10:41 pm
- Station model: Barani MeteoHelix
- Software: meteobridge
Re: updated windRose block
How do you syntax these colors in the settings? I see no example config anywhere...
Mine looks really weird/empty now, using the latest windRose block:
-
- Expert
- Posts: 862
- Joined: Tue Jan 12, 2021 8:03 am
- Location: Italy
- Station model: WH2650
- Software: WH2650 (direct upload)
- Contact:
Re: updated windRose block
ver 1.5
- added option to show max wind gust line
- Attachments
-
- windRose_1.5.zip
- (5.08 KiB) Downloaded 88 times
-
- Expert
- Posts: 862
- Joined: Tue Jan 12, 2021 8:03 am
- Location: Italy
- Station model: WH2650
- Software: WH2650 (direct upload)
- Contact:
Re: updated windRose block
Sorry, didn't reply to this post ( had a 'quite hard time' at work last april/may so missed a 'few post' )
- this is my setting:
-
- Advisor
- Posts: 89
- Joined: Fri Sep 24, 2021 10:41 pm
- Station model: Barani MeteoHelix
- Software: meteobridge
Re: updated windRose block
The mouse-over for the wind gusts shows values that did not occur.. Some calculation is not working as it should.
Currently for example it shows for the 1h interval that there was an 80km/h gust, while we're only at 50km/h peak gusts according to stationData and the source weatherstation max value collected.
-
- Expert
- Posts: 862
- Joined: Tue Jan 12, 2021 8:03 am
- Location: Italy
- Station model: WH2650
- Software: WH2650 (direct upload)
- Contact:
Re: updated windRose block
ver 1.7 ( 2024-01-10 )
- corrected gust speed ( was multiplied by 2 )
- Attachments
-
- windRose_1.7.zip
- (5.09 KiB) Downloaded 48 times
-
- Forecaster
- Posts: 182
- Joined: Mon Jan 31, 2022 4:41 pm
- Location: Sint-Katelijne-Waver, Belgium
- Station model: Davis Vantage Pro 2
- Software: Meteobridge
- Contact:
Re: updated windRose block
hi something funny happened with the windrose....it's not a rose anymore.....
@Davidefa: any ideas?
-
- Forecaster
- Posts: 182
- Joined: Mon Jan 31, 2022 4:41 pm
- Location: Sint-Katelijne-Waver, Belgium
- Station model: Davis Vantage Pro 2
- Software: Meteobridge
- Contact:
Re: updated windRose block
it's a browser issue... only in firefox apperently: how to fix?
Grtz
a
Grtz
a
- tobydude
- Forecaster
- Posts: 192
- Joined: Sun Jan 07, 2018 6:43 pm
- Location: Norway
- Station model: Netatmo
- Software: Weatherdiaplay
- Contact:
Re: updated windRose block
Mine too.
But only in Opera browser.