soil station
-
mchd17
- Forecaster

- Posts: 188
- Joined: Sat Mar 17, 2018 2:01 am
- Location: Illinois
- Station model: Davis Pro2 Plus
- Software: Meteobridge
soil station
How about a soil station plugin like the Indoor data plugin. I am using 4 temp and 4 moisture sensors. It would be cool to keep the max and min data, and be able to show that. With a graph you would be able to see rise and fall in sensors.

-
andyk1
- Professional

- Posts: 431
- Joined: Tue Feb 27, 2018 10:56 pm
- Location: OKLAHOMA, USA
- Station model: Ecowitt WS90
- Software: Meteobridge/GW2000B
- Contact:
Re: soil station
Looked at your site and very impressive. Mind sharing what sensors, model number...
-
mchd17
- Forecaster
- Posts: 188
- Joined: Sat Mar 17, 2018 2:01 am
- Location: Illinois
- Station model: Davis Pro2 Plus
- Software: Meteobridge
Re: soil station
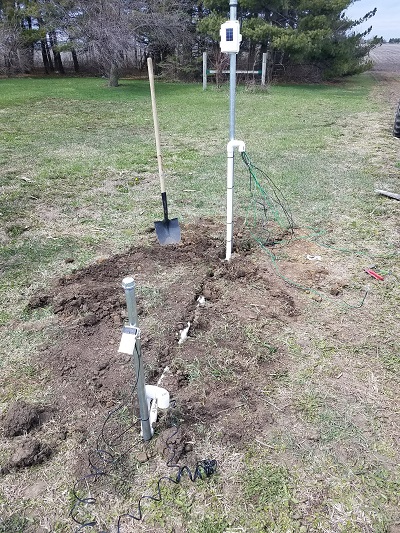
I went with the complete soil station from Davis. Comes with 4 temp and 4 moisture. I also installed a Leaf Wetness Sensor. All wires are ran through pvc.
-
andyk1
- Professional
- Posts: 431
- Joined: Tue Feb 27, 2018 10:56 pm
- Location: OKLAHOMA, USA
- Station model: Ecowitt WS90
- Software: Meteobridge/GW2000B
- Contact:
Re: soil station
Well now I am really, really impressed. Seems like to you did it the right way with a lot of effort. May have to look into this as I have a lot of farmers close by also.
-
Jachym

- Site Admin

- Posts: 1686
- Joined: Fri Aug 18, 2017 10:12 pm
- Location: Brno, Czech Republic
- Station model: WH1080
- Software: Meteobridge
- Contact:
Re: soil station
Hi,
the API supports unlimited number of soil T and moisture sensors so you can save these to the db (use the Extra sensors section in the Control panel)
the API supports unlimited number of soil T and moisture sensors so you can save these to the db (use the Extra sensors section in the Control panel)
-
mchd17
- Forecaster
- Posts: 188
- Joined: Sat Mar 17, 2018 2:01 am
- Location: Illinois
- Station model: Davis Pro2 Plus
- Software: Meteobridge
Re: soil station
Hey Jachym
I already am saving soil sensors to db. Now what's the best way to graph them? High charts? Suggestions or ideas would be great. Thanks
I already am saving soil sensors to db. Now what's the best way to graph them? High charts? Suggestions or ideas would be great. Thanks
-
Jachym
- Site Admin
- Posts: 1686
- Joined: Fri Aug 18, 2017 10:12 pm
- Location: Brno, Czech Republic
- Station model: WH1080
- Software: Meteobridge
- Contact:
Re: soil station
Apart from very few exceptions I use Highcharts, which is IMHO the best graphing library. Very rarely I also use Rgraphs or D3 for things Highcharts cant do, but they are far more difficult to use.
-
WSKO_Karlchen
- Observer

- Posts: 13
- Joined: Fri Apr 20, 2018 10:41 am
- Location: Koblenz / Germany
- Station model: Davis Pro 2 aktiv
- Software: weewx 4.1.1
- Contact:
Re: soil station
Is there any graphical solution for visualizing the "soil-datas" like temperature charts?
Wetterservice Koblenz