Page 1 of 1
Multiple graph block idea
Posted: Fri Oct 20, 2017 8:13 am
by Bassmo
Hi everybody,
I have an idea for a new block that I would like to have in my page

Basically it is a WeatherUnderground-like view of the main graphs alltoghether.
I've prepared a mockup of my idea:

Is it just my idea or anyone else would use it?
I hope that Jachym will take the idea and implement it

Thaaanks
Bye
Luca (
www.meteocassina.it)
Re: Multiple graph block idea
Posted: Fri Oct 20, 2017 8:28 am
by Jachym
Hi,
the problem with this is that its way too big for a block, I try to make the blocks compact so that there can be quite a few on the homepage. Placing this on the homepage would take up 50% of the entire homepage.
Re: Multiple graph block idea
Posted: Fri Oct 20, 2017 9:47 am
by Bassmo
Yes of course, in my idea it could be the whole central column on the desktop homepage.
It would be used by the ones who will like the idea bof this "big impact" block

It is not for everybody I suppose
Re: Multiple graph block idea
Posted: Fri Oct 20, 2017 9:52 am
by Bassmo
It could be paramentric...like dynamicImage for example.
there could be a setting in which i select the default graph (like now), but if I want more graphs to be displayed i put them in a list with semicolons, example:
T;H;W;...
So everybody configures it as nedded
I guess it is harder to develop this way than the "fixed" one...
Re: Multiple graph block idea
Posted: Fri Oct 20, 2017 5:11 pm
by Jachym
Hi,
you could use the interactiveGraphBlock.php script, make copies of the graphs in the code and give them unique names and then modify the AJAX request to load all the data.
Re: Multiple graph block idea
Posted: Mon Dec 11, 2017 4:38 pm
by ChrisBoom
Phew, I've looked at the code and most of it goes wayyyyyy above my head. So no chance of modifying that. I tried duplicates of the dynamicGraph block, but somehow it handles only the first request and leaves the remaining blocks empty. But I love the compact plotting style in the narrow/mobile version, so I'll keep on trying.
I'd certainly like a small, handy all-in-one graph like meteoplug can do, but I don't see me going down Flash road.
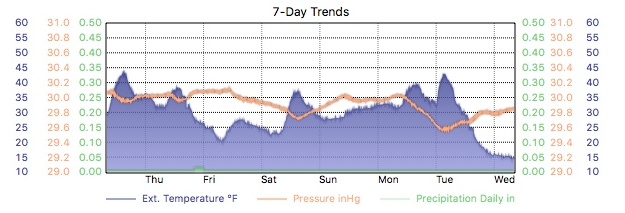
The narrow block version of 'trends' does a bit of what I'm looking for, but it doesn't have wind direction and no time scale. It'd be nice to have it at one glance - or a customizable graph in plugin.
Wind direction would be especially important to me, as this is a parameter that our weather here heavily depends on. Any change is significant.
Anyone with an idea on such a block or workaround?
Edit: As for the all-in-one idea, I found the summary graph buried deep inside the reports plug-in. That looks great, although it's missing wind direction. It'd be awesome if we could have this summary graph as a customizable block nonetheless. Or am I just missing something like that which already exists?
Re: Multiple graph block idea
Posted: Mon Dec 11, 2017 9:29 pm
by Jachym
Here is the issue I see with this:
- having several graphs below each other is not practical - takes up too much space, hard to compare anyway
- having an all-in-one graph would work, but if you see 5 or 6 lines in a single graph, with no possibility of using different colors, thus only using dashed, dotted, solid etc. lines, it becomes a mess. And having several axes on each side also takes a lot of space, so it is a bit of a problem either way
Re: Multiple graph block idea
Posted: Wed Dec 13, 2017 1:19 pm
by MonyMony
This is something I too always have wished for. Using WeatherCat I can generate a graphic with up to three parameters which really is about the max you can really show and still know what you are looking at.
- Screen Shot 2017-12-13 at 8.13.06 AM.png (160.12 KiB) Viewed 15929 times
I have customized things in WC to use different layering and shading to represent the three values I personally like to show. I suspect the graphing options used by MeteoTemplate could be configured to do something similar but there never seems to be enough time to explore all the capabilities.
While this does not really help much, you are not alone ChrisBoom in your desire to have something like this.
Jay
Re: Multiple graph block idea
Posted: Wed Dec 13, 2017 3:58 pm
by ChrisBoom
Perhaps a few more ideas why I like combined graphs so much:
Whenever we discuss weather, we usually can't look at isolated parameters (wind speed, direction, temp, hum etc.) as they change all at the same time, impacting our local conditions. I've always been fascinated by how those parameters interact and I love to watch and discuss their correlation in distinct weather events. I did that a lot with my old site and its weather blog. The all-in-one meteoplug graph was a favourite when it came to illustrating those weather events. Plus, it was the most popular chart with the site visitors.
Another reason why I like combined graphs is that the correlation of changes displayed allows me to make short-term forecasts. Knowing the weather around here and how it usually (!) changes, I know from experience what to expect. Combined graphs make it easier to spot significant changes.
I've set up a test version of meteoplug (again) and it turns out a rather nice chart, but it's a 500k monster. Plus, I wouldn't know how to use this in a block or custom page.
http://www.wachtendonkwetter.de/daychart.html
Perhaps a handy block or plugin will come along some time. Until then, I'll keep on tinkerin' with what's available and see where it takes me.

Cheers
Chris
Re: Multiple graph block idea
Posted: Wed Dec 13, 2017 6:10 pm
by Jachym
But guys there is already such graph, it is in the daily reports and there is plenty of space there because it covers the full page, unlike a block. Im not saying it is a bad idea to include it, Im saying I dont see it as a good idea as a block, because blocks must be relatively small
Re: Multiple graph block idea
Posted: Tue Sep 22, 2020 5:28 pm
by WSKO_Karlchen
I also prefer a block which is customizable - to visualize a few sensor data in one window.
But i have another problem - the dynamic graphs clock is always 1-2 hours in the future - because of daylight savings...
How can we fix this?
If you wat to take a look:
http://www.wetter-koblenz.com
Re: Multiple graph block idea
Posted: Tue Sep 29, 2020 5:57 pm
by iatros
@ChrisBoom
A smaller graph would fit in an iframe in the Blank Block, like:
<iframe style="background:#c8d8bd; border:none; margin:none; padding:none; align:center; width:98%; height:350px;" src=
https://www.meteoplug.com/cgi-bin/meteo ... d7c5c2d4dd"> </iframe>
(Allow Flash Player!!)
This block shows old data from my former station site; I recently moved home, so there are only few data on
https://meteo.dubler.com (Block "Hitzetage / Tropennächte /Eistage"). Another Blank Block is "Extremwerte".
Hope that helps, Martin