Page 2 of 2
Re: updated interactiveGraph block
Posted: Tue Mar 22, 2022 4:52 pm
by Gerrit
Good day to you,
My site is
https://www.waskolkweer.nl/meteotemplat ... esktop.php
The block is at the bottom of the page as a footer,
Gerrit
Re: updated interactiveGraph block
Posted: Tue Mar 22, 2022 6:46 pm
by alexvanuxem
HI David,
thank you for version 7.
i didn't see it untill today. Cool for the calculated solar!
small question: for extra temperature and humidity: does that include indoor. If yes, what's the synthax in the settings?
Tried every possibility. If no: no worries, just nice to have.

Thank you for the great work and site updates!!!
Grtz Alex
Re: updated interactiveGraph block
Posted: Tue Mar 22, 2022 7:40 pm
by davidefa
You could have a typo in the 'default graph interval' setting: last30days ( and not 30d )
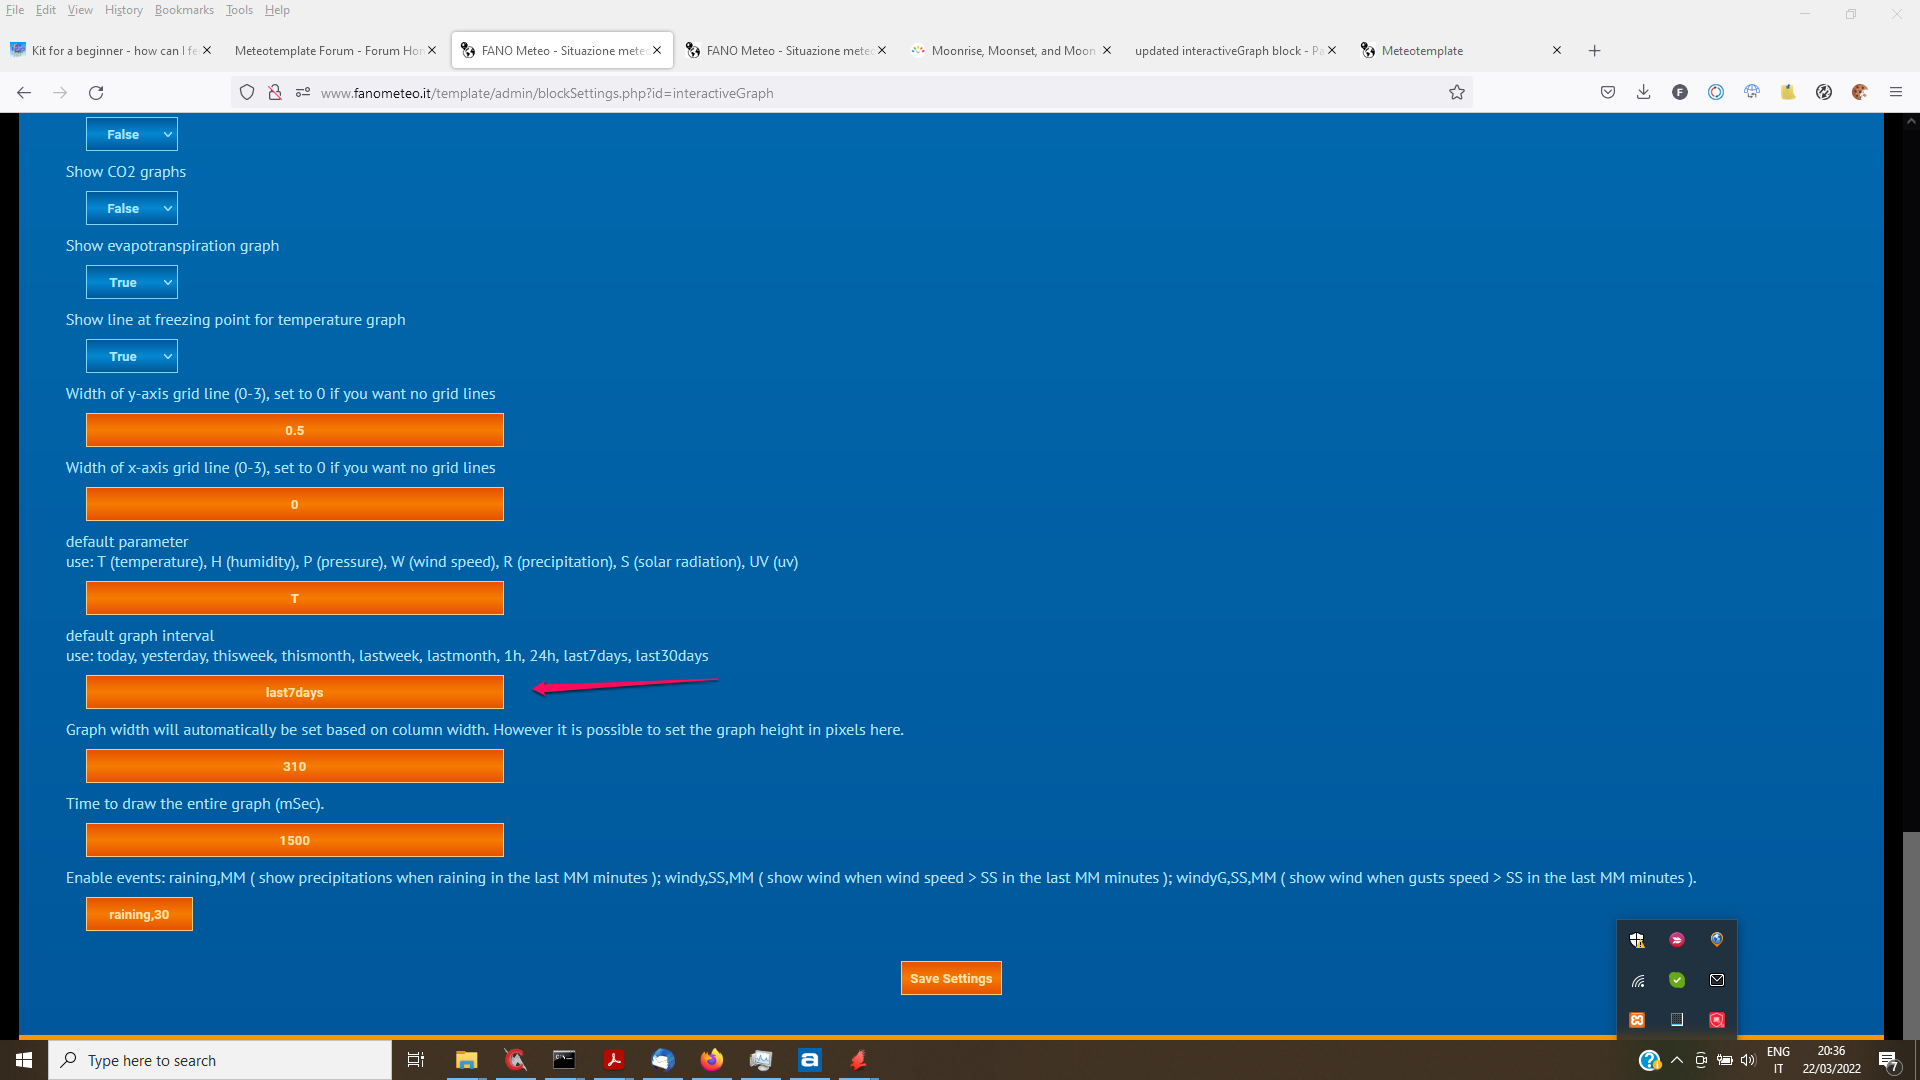
- interactive02.png (126.65 KiB) Viewed 74533 times
Re: updated interactiveGraph block
Posted: Tue Mar 22, 2022 7:52 pm
by davidefa
alexvanuxem wrote: ↑Tue Mar 22, 2022 6:46 pm
HI David,
thank you for version 7.
i didn't see it untill today. Cool for the calculated solar!
small question: for extra temperature and humidity: does that include indoor. If yes, what's the synthax in the settings?
Tried every possibility. If no: no worries, just nice to have. :-)
Thank you for the great work and site updates!!!
Grtz Alex
No currently indoor T/H are not included ( but I can add in the next release )
Re: updated interactiveGraph block
Posted: Tue Mar 22, 2022 8:19 pm
by Gerrit
You could have a typo in the 'default graph interval' setting: last30days ( and not 30d )/quote]
It was indeed, explains why I saw data in the graph until 2011,
The graphs you referred to on your site look very good, by the way.
Gerrit
Re: updated interactiveGraph block
Posted: Thu Mar 24, 2022 9:34 am
by tobydude
Re: updated interactiveGraph block
Posted: Sun Mar 27, 2022 7:38 am
by Gerrit
Hello David,
You said Wednesday to have a look at the
http://www.fanometeo.it/template/pages/ ... hp?var=SM1 page on your site, I have seen it for a while and now I want to see it again and I only get a white screen and a security message, has something changed on the page, when I want to go to your PM10 page I also get a white screen
Gerrit
Re: updated interactiveGraph block
Posted: Sun Mar 27, 2022 10:26 am
by davidefa
It should be ok now ( only a 'small error' in dealing with cached data )
Re: updated interactiveGraph block
Posted: Sun Mar 27, 2022 5:29 pm
by Gerrit
It is visible again, thanks
Re: updated interactiveGraph block
Posted: Sun Apr 17, 2022 2:24 am
by mchd17
found minor issue
Extra Temp sensors, temp on graph is in C but listed as F, graphs are in C would like to be in F
Re: updated interactiveGraph block
Posted: Mon Apr 18, 2022 2:59 pm
by davidefa
ver 11.8
- corrected extra temp sensors not converting to °F
ver 11.9
- corrected extra sensors json data indexing (when selecting out-of-sequence sensors )
- added lightning sensor
- added leaf wetness sensor ( untested )
Re: updated interactiveGraph block
Posted: Thu May 12, 2022 7:50 am
by georg
Hello
I have a problem with the interactive graph.
When opening my page the time on the graph is two hours ahead of the actual time.
(today starts at 2)
Data is correct in the database.
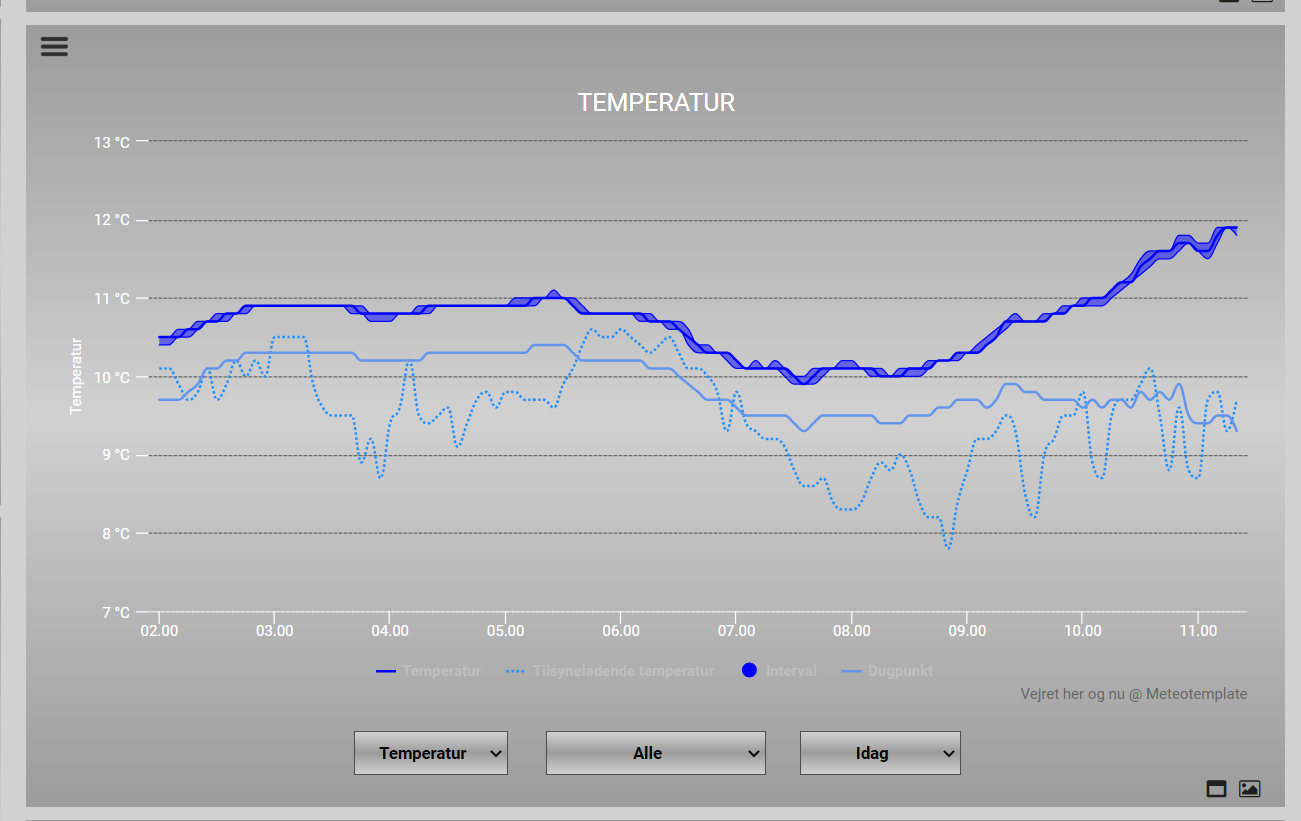
- FireShot Capture 097 - Vejret her og nu - https___vejr.arloese.dk_template_indexDesktop.php.png (95.51 KiB) Viewed 74215 times
If i then select the 3 bars in the upper left corner of the block (menu option)
and select interactive graph it loads correct (and in the correct backgraund color)
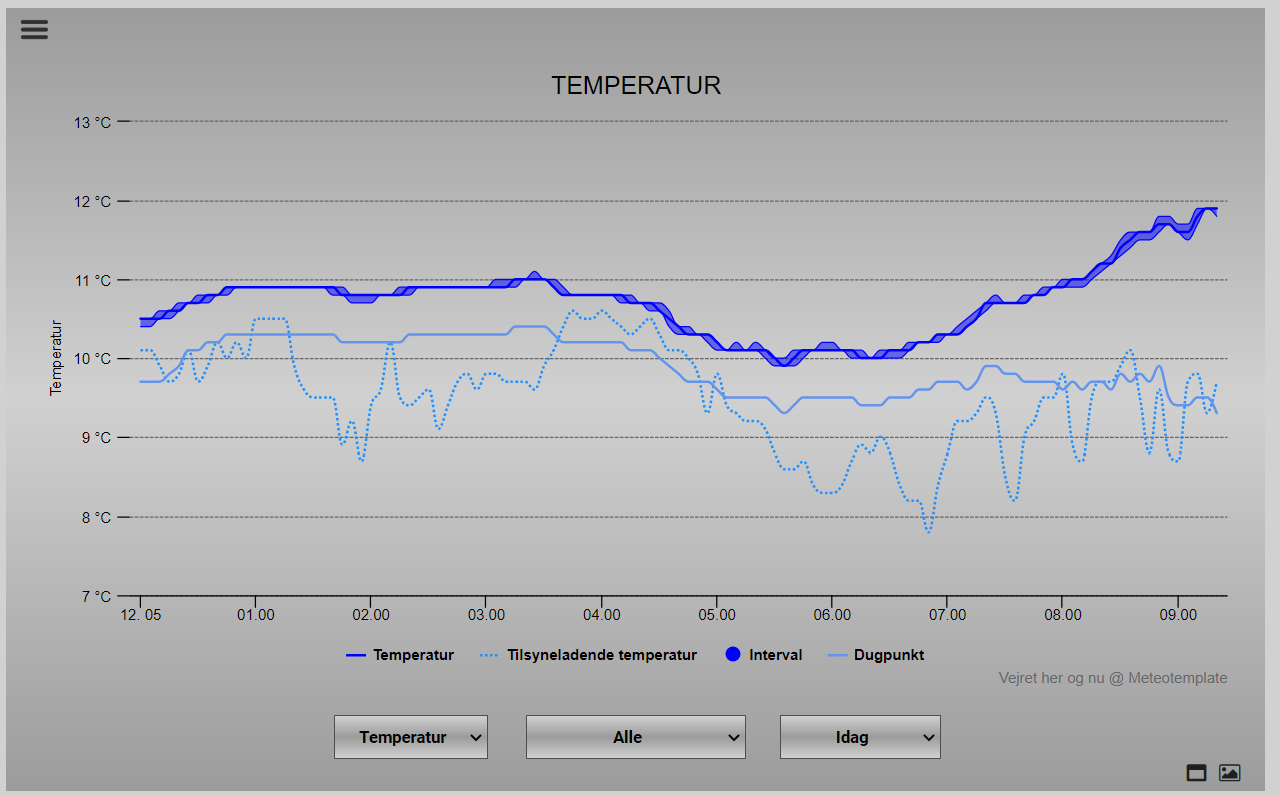
- FireShot Capture 098 - Vejret her og nu - https___vejr.arloese.dk_template_indexDesktop.php.png (86.54 KiB) Viewed 74215 times
I can not figure out how to get it to load correctly in the first place (anything to do with high chart, Denmark is 2 hours ahead of UTC i the summer)
Thanks for the updated block, really good work.
georg
Re: updated interactiveGraph block
Posted: Tue Aug 30, 2022 9:41 am
by Julius
davidefa wrote: ↑Mon Apr 18, 2022 2:59 pm
ver 11.9
- corrected extra sensors json data indexing (when selecting out-of-sequence sensors )
- added lightning sensor
- added leaf wetness sensor ( untested )
Is there already a method to have 3 Temperature sensors (T,T1,T2) show in one graph?
And how do I designate sensors (T1, T2) to the correct numbers for the colors/names?
Re: updated interactiveGraph block
Posted: Thu Sep 01, 2022 9:46 pm
by davidefa
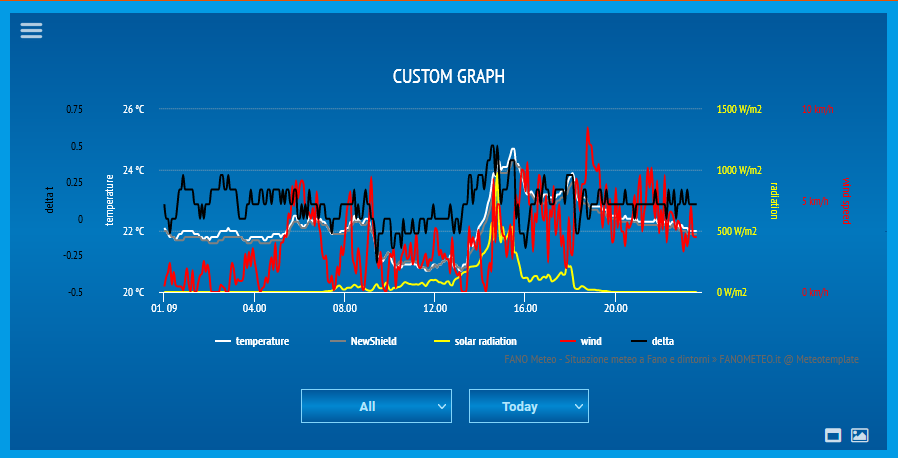
You can use the customGraph block, it can show any sensor on a maximum of 4 different Y axis.
For temp only sensors you need to set the initial parameters ( Y axis 1 parameters )
This is the configuration I use for the first axis ( simply add the third temp sensor in the highlighted fields )
P.S.
You can also do a 'little of math' if you need ( for example I defined the fourth axis as: T-T4=delta
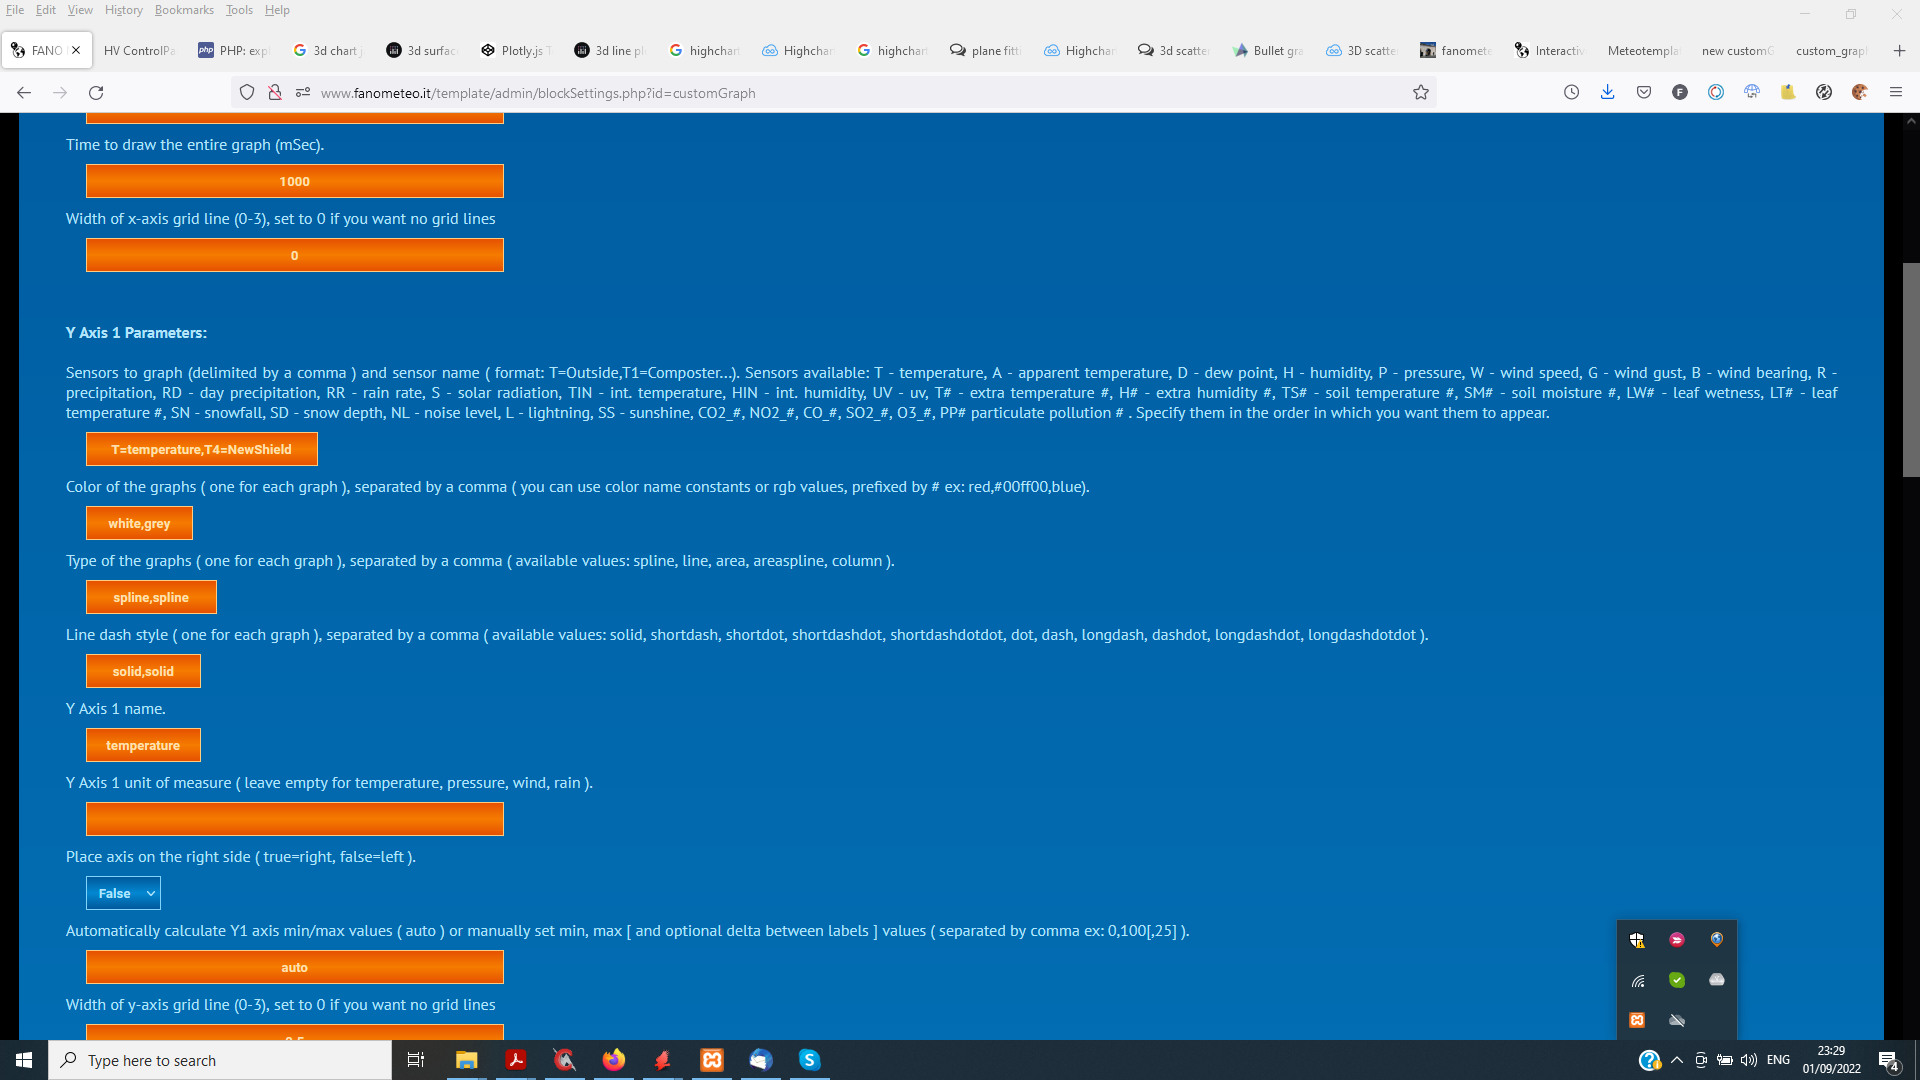
- custom_graph3.png (145.52 KiB) Viewed 73598 times
- custom_graph4.png (62.29 KiB) Viewed 73598 times
Re: updated interactiveGraph block
Posted: Thu Sep 01, 2022 9:52 pm
by davidefa
@georg
Sorry I missed your post.
There are a lot of unwanted interactions between blocks, ( utc/local time settings are not uniformly handled between blocks ). Need to understand more about this.
Thank you for pointing this out
Re: updated interactiveGraph block
Posted: Fri Sep 02, 2022 11:39 pm
by Julius
davidefa wrote: ↑Thu Sep 01, 2022 9:46 pm
You can use the customGraph block, it can show any sensor on a maximum of 4 different Y axis.
For temp only sensors you need to set the initial parameters ( Y axis 1 parameters )
This is the configuration I use for the first axis ( simply add the third temp sensor in the highlighted fields )
Sorry, I don't understand your explanation here.
If I have 3 sensors, T,T1,T2 that I want to show in one graph, how do I enter its values?
See the customGraph in the center
here; It's really strange, the time on the horizontal axis is incorrect (it shows the future?).
Also, the naming of the colors under it is in km/h (probably mingles with code from windrose?)..
georg wrote: ↑Thu May 12, 2022 7:50 am
Hello
I have a problem with the interactive graph.
When opening my page the time on the graph is two hours ahead of the actual time.
(today starts at 2)
I have exactly the same issues, but with customGraph. Looks like a style naming convention issue interacting with another block (windRose?).
Re: updated interactiveGraph block
Posted: Thu Dec 28, 2023 7:19 pm
by Gary
Hi,
I really like this latest version of the interactivegraph block, esp as in brings in the extra sensors.
I have a couple of questions, sorry if they got answered before and I didnt notice.....
1: the titles of the graphs display in uppercase, is there a way to change this?
example, from TEMPERATURE to TEMPERATURE or from WIND to WIND
Reason for asking is the other blocks I am using all display the block title in the latter style, so I would like it to be consistent.
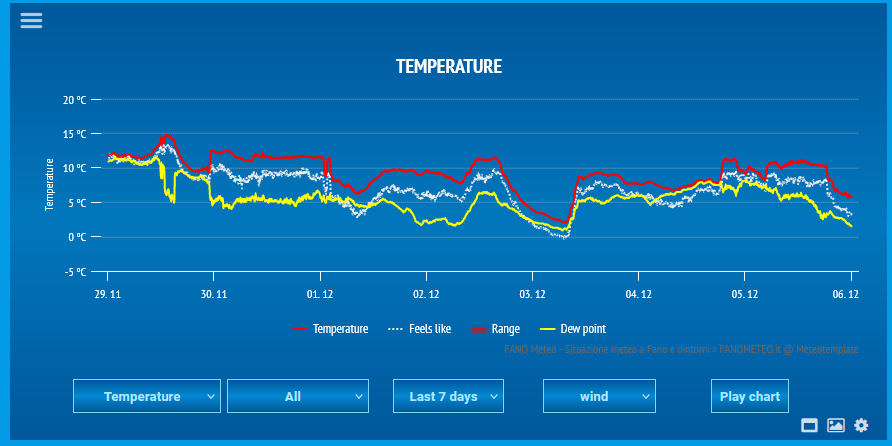
2. Some of the graphs have several items displayed
example 1 TEMPERATURE shows: Temperature, Apparent Temperature, Range, Dew Point.
example 2 WIND shows: Wind Speed, Wind Gust, Bearing
I am not so interested in Range and Dew Point in example 1 and Bearing in example 2 displaying on the chart display.
I know I can turn these items "off" or to blank by clicking on them, but I would prefer to have the chart to be without these items showing to start with.
Thank you in advance for your help.
Gary
Re: updated interactiveGraph block
Posted: Thu Dec 05, 2024 11:15 pm
by davidefa
Why not adding stupid things to meteotemplate... like sonification ( why not 'listening' to temperature variation )?
ver 12.0
- added sonification ( select a sound and click on play chart )
NOTE
You need also to modify the indexDesktop.php script adding the following line ( near line 211, after similar script tags ):
Code: Select all
<script src="//code.highcharts.com/modules/sonification.js"></script>
- interactiveGraphSonification.png (54.94 KiB) Viewed 68619 times
Re: updated interactiveGraph block
Posted: Fri Dec 06, 2024 10:27 am
by Jolumarali
Thank you, orchestra man
Re: updated interactiveGraph block
Posted: Fri Dec 06, 2024 4:37 pm
by alexvanuxem
Re: updated interactiveGraph block
Posted: Thu Jan 16, 2025 7:55 pm
by marcom78
Hi all
is there any possibility to remove the max-min highlited red area ?
I'm currently using rev 12.0
Thanks
Marco
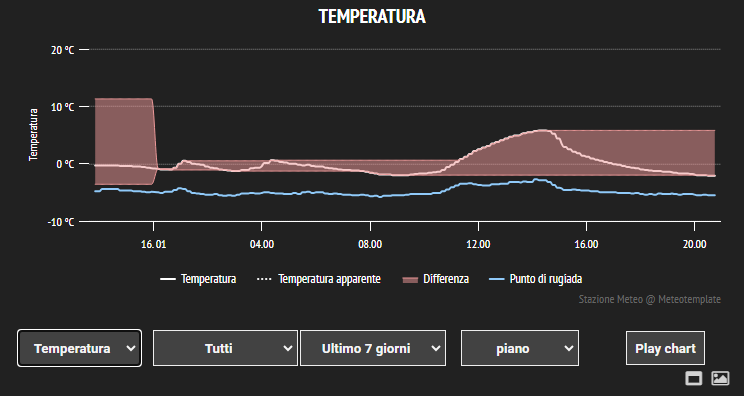
- Cattura.PNG (21.87 KiB) Viewed 66384 times